The S&P 500 is printing record highs while the median American can’t afford to fill a gas tank. This isn’t a paradox. It’s a stratified economy doing what stratified economies do — until it can’t.
Why Asset Prices Keep Rising When Economic Growth Is Weak
Many things are true at the same time and it’s hard to know which is wrong and which is right. The S&P keeps hovering new highs. Asset prices keep rising. Weak growth as Twelve-month inflation expectations leapt to 4.7%. Consumer Sentiment Index just had its lowest reading below 2008 and 2022 inflation peak. Q4 2025 GDP was revised to 0.5% annualized from 4.5% in Q3 2025. Q1 2026 print just came in at 2% almost entirely from AI capex and Goverment spending. Amazon, Alphabet, Meta are about to spend roughly $700 billion on AI this year. Goldman Sachs estimates AI investment will drive 40% of all S&P 500 earnings growth in 2026 equivalent to more than 90% of the hyperscalers’ expected cash flows this year.
So, what side of the data is lying? It’s about which data is lying cause none of them are. What’s interesting is why the markets are topping at all-time highs while Consumer price index is drowning.
What I have been hearing around from others is that markets are forward looking and thus it’s pricing in optimism. That answer is wrong and is something that is vaguely passed around my people who don’t want to understand stuff in detail. The markets are not making a single bet on growth. They are making a structural bet (long term bet) that a parallel economy- capex funded, asset ownership driven, supported by passive flows can be separated from the wage economy. A bet that that capital spending on AI, asset owner earnings, passive flows in ETFs/ funds/ retirement allocations can keep doing well and keep pulling the markets up while ordinary people suffer. The important piece here is that it’s a structural bet that this thrives for a period more than the fundamentals normally allow.
SECTION I
The Evidence of Weak Growth
Update April 30: Q1 GDP printed at 2.0%, above the GDPNow estimate of 1.2% cited below. However the composition tells the real story — PCE inflation surged to 4.5%, core PCE to 4.3%, and much of the growth reflected one-time shutdown rebounds and pre-tariff import stockpiling. The stagflation argument in this note grew stronger, not weaker.
Starting with GDP because the deceleration is more violent that reports or news suggest. Q3 2025 grew 4.4% annualized. By the time BEA’s third estimate of Q4 arrived on April 9th, the number was already revised to 0.5%. The shutdown of strait explains a part of the fall. It doesn’t explain the rest. Consumer spending decelerated to 1.9%, government spending contracted 5.6%, residential investment 1.7%.
GDPnow which is a live tracker of GDP based on the incoming economic data updates as the data comes in for the economy. It’s not a forecast. It’s where the economic data is actually pointing. At beginning of quarter, estimates suggest growth around 3%. By April 21st, the estimates are now revised to a GDP growth of 1.2%. 60% downgrade in eleven weeks due to lower consumer spending and lower inventories
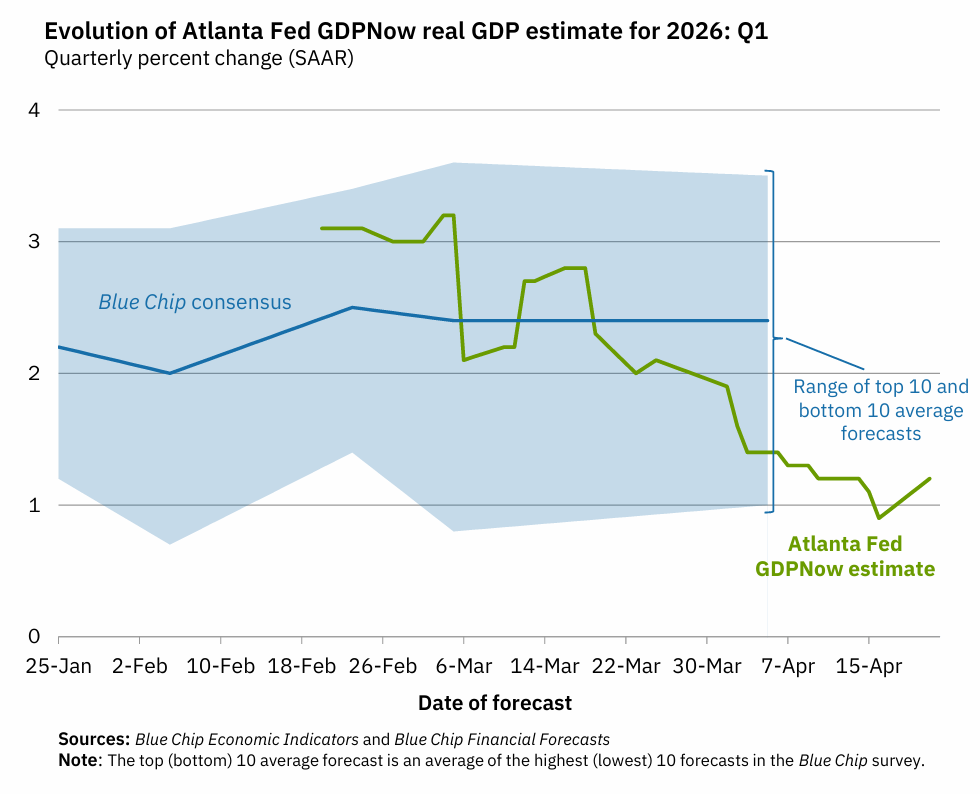
Data via GDPNow. Screenshot captured 30 Apr 2026.
The ISM data is doing something weird. March manufacturing PMI was 52.7 which is expansionary as it’s the third consecutive month above 50. But employment was stuck at 48.7 (eight straight month in contraction). Prices paid surged to 78.7, the highest since 2022. Sixty four percent of panels comments were negative (few seen below). Services PMI fell to 54.0 with employment turning negative for the first time in four months. What does all of this mean? Factories are still producing well, but they’re not hiring and they are paying more for the inputs.
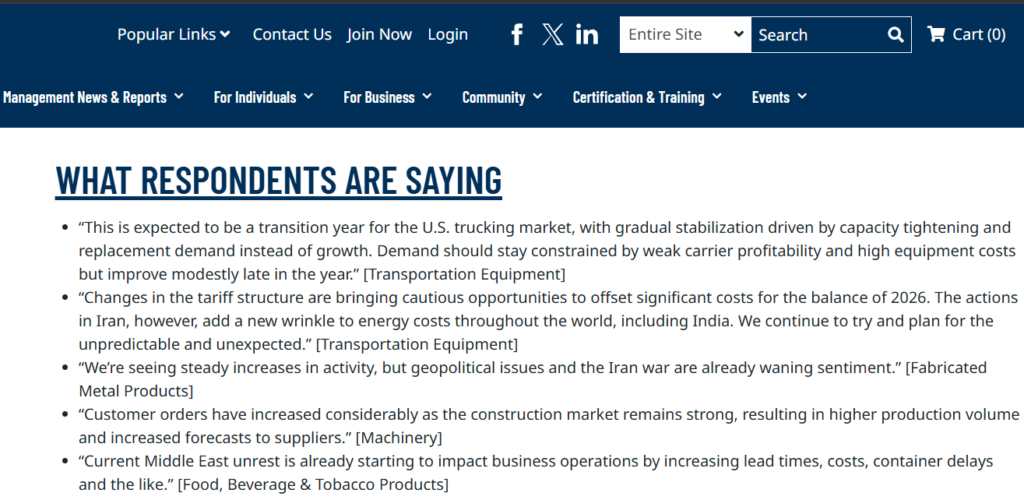
Data via ISM PMI Report.
Year-ahead inflation expectations jumped to 4.7%, five-year expectations to 3.5%, the highest since October 2025. March data confirmed this at 3.3%. This is a household sector that has stopped planning and started rationing.
The main source of pain and burn for the ordinary consumers from the war is gas prices. Goldman Sachs’ Ronnie Walker estimated that gasoline price increases since the Iran war began represent a $140 billion annualized headwind to household income at current prices. That suggests $140 billion not available for consumer spending. Even under Goldman’s base case which is brent crude retreating under $80 by year end, the full year 2026 hit lands around $70 billion. This form of tax hits more for lower and middle-class households, for whom the fuel is a major part of monthly spending. Higher inflation argues for tightening; slower growth argues for easing. The Fed is pinned and waiting.
The Policy Question Nobody Wants to Discuss
One of the reasons why today’s growth looks worse is cause the markets and policy makers assumed that the rate hikes from the Fed already worked through the system. The fed’s fund rate post covid has been at or above 3.5%. US 10 year treasury notes also sat elevated at 4% for most of that period. Corporate sector refinanced cheaply during covid period when interest rates were really low.
Most of that refinancing came due in 2025–2027. Many companies staggered maturities into future years during covid to 2025-2027. Now those bonds/ loans mature and must be rolled over. This maturity wall in high-yield bonds and leveraged loans is the next stress test. It’s approaching at funding costs roughly 300bp above where the original debt was made. The default cycle hasn’t begun yet cause the firms have been extending where they can. But even the FOMC’s March Minutes flagged increasing concerns over private credit.
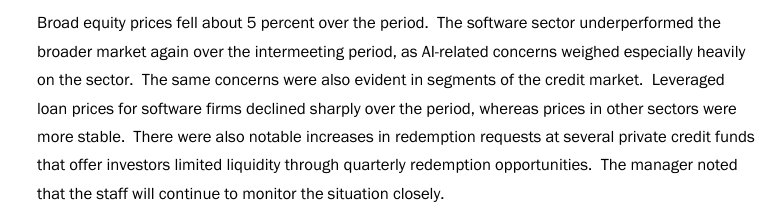
Data via FOMC March Minutes.
SECTION II
The evidence of strong asset prices
Now flipping the page. The S&P500 at an all time high on April 28 at 7173 (now 7,230+ as of May 1 – the divergence has widened further) Nasdaq record close at the same session. Intel jumped 23% on earnings last week. Nvidia retook $3 trillion. The motley fool quoted that the S&P just moved from oversold to overbrought at the fastest pace in almost four decades. The important thing to notice here is the breadth of the gain.
Two years ago, S&P at an all time high meant Mag Seven at an all time high. Now the coorelation has loosened. Gains are spreading beyond mega cap tech. Roughly 65% of S&P constituents now trade above their 200-day moving averages. It suggests positive medium-term momentum.
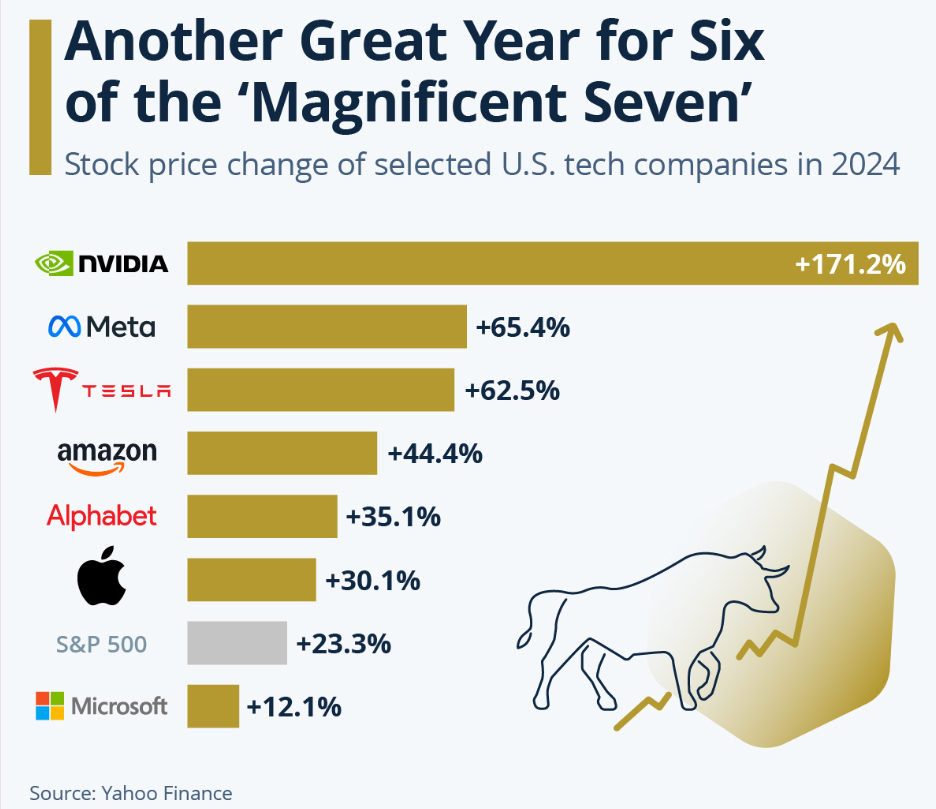
The Mag Seven still represent 33.7% of the S&P 500, up from 12.5% in 2016. One-third of the entire index depends on these seven companies. Passive investors are heavily exposed whether they realize it or not. They trade at roughly 30x forward earnings a 60% premium to the rest of the index. US 10 year treasury notes now yielding 4.12% post covid offers a great incentive. Why pay 30 times earning for a stock when bond offers safe meaninful yield? That math has been ignored for the past two years and shareholders have done fine. But the math eventually wins and when it does the unwind seems to be automatic and fast.
Investment-grade spreads have widened just 5 basis points since February 28 the date on which the United States effectively went to war with a major oil producer. Normally risk should reprice more. Defaults are relatively low and credit stress has not appeared yet. High yield spreads are tighter than expected. The bond market is refusing to reprice risk. This is the carry trade speaking not the fundamentals. When investors are being paid 8% for taking junk risk, the math of holding rather than selling makes sense until something forces the issue.
Whether the spreads widen due to the maturity wall approaching the credit market? That’s something to be seen and to keep a watch on.
SECTION III
Why the Gap Exists: The Divergence explained
Layer One: AI Capex Is a Private Fiscal Stimulus
The single most important fact about this market is one that doesn’t show up in macro data. Amazon, Alphabet, Meta, and Microsoft will spend between $635 billion and $700 billion in 2026 capital expenditure which is a 67–74% increase from 2025. Amazon alone has guided $200 billion. Alphabet $175–185 billion. Meta $115–135 billion. CreditSights estimates roughly 75% of that about $450 billion flows directly into AI infrastructure. Think GPUs, networking, data centers, custom silicon. Nvidia captures roughly 90% of accelerator spend.
Now hold that next to what’s macro saying. This hyperscaler capex bill is more than 4x what the entire publicly traded US energy sector spends annually to drill, refine, and distribute. And crucially it does not flow through the consumer at all. Capex is being deployed by four boards with quarterly accountability rather than a Congress with electoral cycles. None of those line items care about gasoline prices or Michigan sentiment.
This is the mechanism most macro frameworks miss. When 33.7% of an equity index is concentrated in firms whose revenue and capex cycles are increasingly self-contained driven by their own cloud customers and their own AI products the index can rationally diverge from the broader economy. The Mag Seven aren’t ignoring the consumer because they’re irrational. They’re ignoring the consumer because the consumer is no longer their primary revenue input.
“The hyperscalers are spending more than 4x what the entire US public energy sector invests annually — in twelve months. That’s not a capex cycle. It’s a balance-sheet event with macro consequences.”
To finance $700 billion of capex, the four hyperscalers are issuing more than $400 billion in new debt more than double 2025’s $165 billion. Free cash flow is being almost entirely recycled into infrastructure. Amazon has projected FCF negative this year. Barclays estimates Meta’s FCF drops nearly 90%. These are companies historically prized for their cash generation. If the AI revenue conversion disappoints, this becomes a credit story before it becomes an equity story and the equity story will be ugly.
Layer two- The Mechanical Bid
A huge portion of demand now comes from Index passive flows. They are the dominant force at the top of the structure. The Vanguard S&P 500 Etf (VOO) alone saw flow of $120 billion this year. As the MAG7 comprise about one third of the S&P500 by weight, every one third of the passive dollar flows there (roughly $40 billion for VOO this year) regardless of the valuation, earnings or the consumer sentiment
Now asking the question that what if the flows reverse is a smart choice. Net retail and 401(k) flows into US equities have been remarkly positive throughout the Iran shock. The passive phenomenon doesn’t unwind because hedge funds change their minds. It happens when 401(k) contributions/ passive contributions stop which happens when employment cracks. As long as the labour market holds and at the current 4.1-4.3% unemployment, it has the passive investing continues
Layer Three: The Asset-Owner Economy vs. the Wage Economy
Dan North, senior economist at Allianz Trade made the structural point cleanly in April quoting “The top 20% of earners are responsible for 39% of all consumer spending. The top 1% of wealth holders own 50% of the S&P 500.” That is the secret of how this divergence persists. Aggregate consumer spending does not require the bottom 80% to feel confident. It requires the top percentage to keep feeling rich. At S&P at it’s new high 7173 which is also their portfolio statement they do. The economy doesn’t need everyone to feel rich anymore it increasingly just needs the people who own most of the assets to feel rich.
The Iran war gasoline tax falls almost entirely on lower and middle income households. Oxford economics think the most impact would be seen there. Meanwhile the top 10% is enjoying a roughly 30% YoY gain that overcomes any fuel cost increase. So discretionary spending is falling among the lower income consumers, while luxury expenditure and high end spending keeps growing up.
This is fragile if you think about it. As long as employment remains firm, the wage economy can weaken quietly while the asset economy continues spending through rising portfolios and accumulated wealth. But once unemployment begins to rise meaningfully, both sides can crack at the same time. Workers lose income and cut consumption immediately, while asset owners lose confidence in the growth narrative that justified elevated valuations and aggressive spending.
That is why the labor market is the key pressure point. April’s ADP estimate of 40K is worth watching closely. A sub-100K U.S. nonfarm payrolls print would signal hiring momentum is fading and could mark the inflection where a silent slowdown becomes visible. The risk is not just weaker jobs data, it is the possibility that employment softness triggers both a consumption slowdown and a repricing in S&P 500 risk assets simultaneously.
Layer Four: Why Valuations Can Survive Weak Growth Temporarily
Normally high multiples require either high growth or low discount rates. Today’s market has neither in abundance. Growth is decelerating; the 10Y is high at about 4%. So why does 22–23x forward earnings hold?
The answer is a specific composition effect. Index-level multiples are dominated by the Mag Seven’s 30x forward P/E, which is justified for now by hyperscaler revenue growth still running double-digits. Strip out the top 7 names and the rest of the S&P trades closer to 19–20x which is elevated, but not historically extreme. The “expensive market” is really an expensive top 10% combined with a fairly priced rest of the index. That distinction matters because the broad market can absorb earnings disappointment in industrials and consumer discretionary without breaking the headline multiple. The headline multiple breaks if and only if Big Tech’s earnings revisions turn negative.
The answer is a specific composition effect. Index-level multiples are dominated by the Mag Seven’s 30x forward P/E, which is justified for now by hyperscaler revenue growth still running double-digits. Strip out the top 7 names and the rest of the S&P trades closer to 19–20x elevated, but not historically extreme. The “expensive market” is really an expensive top decile combined with a fairly priced rest-of-index. That distinction matters because the broad market can absorb earnings disappointment in industrials and consumer discretionary without breaking the headline multiple. The headline multiple breaks if and only if Big Tech’s earnings revisions turn negative.
Which is why this week’s earnings of Alphabet, Amazon, Meta, Microsoft on Wednesday, Apple on Thursday matter more than any single macro print. The market has built itself around the assumption that these four companies will continue to grow into their capex. If corporate guidance suggests capital expenditure returns are coming in weaker than expected, valuation pressure is unlikely to unfold gradually. The multiple reset would more likely be abrupt and discontinuous, as markets quickly reprice growth expectations rather than adjust them step by step.
Layer Five: The Fed Transition as Shadow Optionality
Powell’s term ends May 15. Kevin Warsh- Trump’s nominee, a former Fed governor sat for confirmation last week. Markets currently price zero rate cuts through year-end (CME FedWatch puts the odds of a hike by Dec at 8% and the rest at hold). But underneath that equity investors are pricing a different expectation that the next Chair, eventually finds a reason to cut. Warsh expressed support for cuts before the oil shock and has gone notably quiet since. iShares’ fixed income team explicitly forecasts 1–2 cuts in H2 once Warsh takes over.
This is hidden upside potential in the market. Stocks are being supported not because rate cuts are fully expected, but because investors still believe there is a small chance the Federal Reserve could turn more supportive and cut rates later. But that same hope also creates risk. If markets believe someone like Kevin Warsh or future Fed leaders are cutting rates because of political pressure instead of real economic data, confidence in the Fed could be damaged. Then investors may sell long-term bonds and demand higher yields.
That would mean long-term interest rates rise even if short-term rates stay flat or fall causing bear steepening. For stocks, that would be very negative as borrowing costs rise, valuations fall, and financial conditions tighten. It would be one of the worst outcomes for risk assets in 2026 precisely because almost nobody expects it right now.
Section IV
What the Rates Market Is Saying
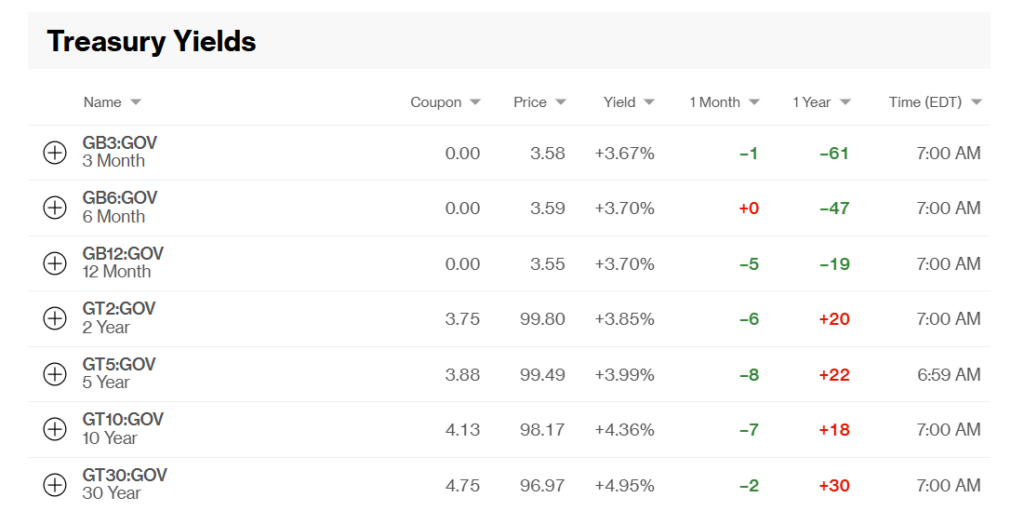
Data via Bloomberg Markets. Screenshot captured 29 Apr 2025.
The front end is pinned by inflation, not policy expectations. The 2-year yield sits where it does because the market has priced out cuts for 2026. The CME FedWatch gives essentially zero probability of a cut at this week’s meeting, fed funds futures imply a hold for the rest of the year and the chance of a hike by December is roughly 8%. That is a market that has accepted the Fed’s hands are tied. The 2Y is no longer a forecast of rate cuts. It is an estimate of the funds rate (current policy staying in place) plus a small term premium for the risk that nothing moves.
The 10-year is doing the heavy lifting. 10-year yield now sits at around 4.35% and 5-year inflation breakeven around 2.4%, the market is implying a real yield of around 1.9%. This is relatively high compared with post global financial crisis eras where yields were often lower. In simple words investors are expecting more in return for holding long term assets. That is not a recessionary signal.
It is a market that thinks growth while soft, is not collapsing and that the term premium (extra yield that investors demand for holding long term assets) needs to be paid for holding duration in an environment where inflation could reaccelerate. The 10Y is refusing to rally meaningfully on weak GDP prints is the bond market expressing skepticism that the Fed will get to cut anytime soon. That is consistent with J.P. Morgan’s view that the next move is a hike in 2027.
The shape of the yield curve matters more right now than the absolute level of yields. A slightly positive spread between the 2-Year U.S. Treasury Note and 10-Year U.S. Treasury Note after years of inversion should not automatically be read as a recovery signal. It can instead reflect a market that expects the Federal Reserve to keep short-term rates elevated for longer, while the long end slowly adjusts to that reality.
The wider 30-Year U.S. Treasury Bond spread versus the front end around +60 basis points leans more toward a bear-steepening setup. That usually suggests investors are more concerned about persistent fiscal deficits, sticky inflation, higher long term premium rather than a recession. If recession were the dominant market view, long yields would already be much lower.
The yield for long term is made up of two pieces. Expected future short term rates and a term premium that the investors demand for locking money for longer maturities. For years, estimates such as those from the Federal Reserve Bank of New York showed term premium in negative territory, meaning investors were willing to accept less compensation to hold long bonds. Over the past year that has moved meaningfully positive. That rise in term premium acts like an additional form of monetary tightening which is why financial conditions remain tighter than the headline funds rate would suggest. If term premium rises further, valuations and liquidity could come under pressure quickly.
The key signal to watch is the direction of the 10-Year U.S. Treasury Note. If the 10-year yield falls below 3.75% because growth fears are rising rather than inflation easing, it would suggest the bond market is pricing a recession that equities have yet to acknowledge. If instead yields move above 4.5% on renewed fiscal or inflation concerns, it would point to a bear-steepening move that mechanically pressures equity valuations through higher discount rates. In either case, the more meaningful risk may be a break from today’s range rather than its continuation.
Section V
Credit: The Most Complacent Asset Class in the World
If equities are at all time highs, credit is at all time chill. Investment grade OAS have widened approximately 5 basis points since the Iran war began on February 28. Just 5 basis points? The United States entered a conflict with a major oil producer. Brent surged 55%. Consumer sentiment hit a 74-year low. And IG credit moved 5 basis points. This seems structurally wrong.
The market mechanics are straightforward. With U.S. Treasury securities yielding above 4%, the Investment Grade Corporate Bonds offering roughly 5.0–5.5%, now provide income levels that historically required taking high-yield risk. That has created strong demand for these IG bonds from pension funds, insurers, and overseas buyers looking for carry. Liability driven investors like these don’t sell bonds because spreads widened 5bps. They buy more, because the carry pays for itself within weeks.
On the surface fundamentals still look solid. Investment-grade corporate balance sheets remain relatively healthy, large-cap earnings are strong, and default rates remain low versus much of the post global Financial Crisis period. Even the Federal Reserve noted in its March minutes that credit performance was “solid for both investment- and speculative-grade firms.” But in the same paragraph in those minutes flagged “increasing investor concerns about private credit because of the sector’s high exposure to software-related business loans that were vulnerable to AI disruption.” That is a remarkable sentence to find in an FOMC document.
Reference- FOMC Minutes.
Private credit is a hidden part of the market with no daily pricing, less transparency, and many loans made to venture-backed software companies now facing pressure from the same Artificial Intelligence boom lifting stocks. Many SaaS firms built on per-seat pricing are losing customers or needing fewer paid seats as AI tools replace workers. Their cash flows are weakening just as floating rate debt has become more expensive to repay. Some of these loans sit on bank balance sheets through warehouse facilities, more sit in Business Development Companies and private credit funds where withdrawals are reportedly rising. This is not yet a crisis. It is the kind of slow pressure that becomes a crisis when one large fund blocks withdrawals and is forced to hedge publicly, making everyone notice.
The carry versus risk tradeoff has become uneven. A high-yield investor today may earn around 7.0–7.5% on a B-rated bond, while expected losses from defaults at current levels may only be about 0.5–0.8%. That means investors are being paid more than 6% in extra income to take credit risk that for now still looks manageable. This is attractive until conditions change. Default cycles usually do not rise slowly and neatly. They often begin when refinancing windows suddenly close. Companies that could once roll over debt can no longer borrow at acceptable rates, and stress builds quickly. As discussed earlier the next major test is the 2026–2027 maturity wall in High-Yield Bonds and leveraged loans. Many issuers will need to refinance debt during that period. Those unable to do so on workable terms may be pushed into restructurings, distressed exchanges, or defaults
The signal to take seriously is to watch the BB-to-B spread differential and the CCC default rate, not the headline IG OAS. The headline number will look fine until the moment it doesn’t. The differentiation under the surface which is the spread between the cleanest junk and the dirtiest typically widens for several weeks before the headline cracks. If CCC spreads break wider while IG holds, that’s the early warning.
Section VI
What Markets May Be Getting Right
AI is real revenue, not narrative. AWS runs at a $142 billion annualized rate and grew 24% YoY. Alphabet Cloud is accelerating. Meta’s ad targeting is measurably benefiting from AI investments. These are not promised future productivity gains. They are current-quarter cash flows hitting income statements. The skeptic who treats AI as 1999 dot-com replay is fighting the wrong analogue.
Post-publication update: Q1 earnings confirmed this- Google Cloud grew 63%, AWS 28%, Microsoft’s AI revenue hit a $37B run rate up 123%. But Meta fell 5% and Microsoft 3% despite beats, as markets began questioning Q2 revenue growth against rising capex. The capex conversion test is now live.
The oil shock has a plausible exit. Iran ceasefire negotiations are ongoing, with Trump indefinitely extending the current ceasefire this week. Goldman’s commodity strategists project Brent toward $90 in Q4 well below the spike high. If the Hormuz risk premium compresses through summer, gasoline prices moderate and consumer sentiment reverts to mean. The Q1 growth scare looks like a temporary supply shock exactly the kind markets are right to look through.
Labor has bent not broken. Nonfarm payrolls of 178K in March is decelerated but not recessionary. Unemployment at 4.1–4.3%. Continuing claims showing employer hoarding rather than firing. There are consumers complaining loudly while continuing to spend.
The market is pricing a specific scenario, not a generic optimism. Strip away the noise and the equity market is pricing hyperscalers to earn their capex, AI revenue conversion accelerates, the oil shock proves temporary, labor holds, and Warsh eventually delivers two cuts. None of those individual assumptions is implausible. The aggregate probability is what’s questionable.
Section VII
What Markets May Be Getting Wrong
The consumer cannot be ignored off forever. Consumer spending is roughly 70% of GDP. The $140 billion gasoline headwind is not a rounding error. Even Goldman’s mean reverting base case puts the full-year hit at $70 billion. Add sticky shelter inflation, food prices, and Core PCE at 2.7%, and the real disposable income picture for the bottom three quintiles is quietly turning negative. Corporate earnings depend on consumer revenue eventually. The asset-economy / wage-economy divergence is sustainable for quarters, not years.
Stagflation is the worst possible regime for multiples. Markets are trading as if inflation will be tamed by year-end and growth reaccelerates in 2027. That is one specific path. The Fed itself revised its 2026 PCE forecast up to 2.7% and signaled no cuts. J.P. Morgan thinks the next move is a hike. There is a meaningful chance the Federal Reserve remains on hold even as growth weakens further. That would mechanically pressure equity valuations because both sides of the pricing equation worsen at the same time. Interest rates stay high, keeping discount rates elevated, while earnings growth expectations move lower.
AI capex may not pay back on the timeline implied. Deloitte’s base case explicitly delays broad AI productivity gains until “after 2027.” Their downside scenario has AI investment “overdone,” with a 2027 capex cliff producing -0.4% and -1.0% GDP in successive years. The hyperscalers themselves are watching free cash flow go negative to fund this. Amazon FCF negative in 2026. Meta’s FCF down 90%. These are the kinds of bets companies make once a generation. Generational bets occasionally lose.
Goldman Sachs’ own strategist flagged in late April that market breadth has dropped to one of its narrowest levels since the dotcom era meaning the headline index masks a market where very few stocks are doing the actual work
Credit complacency can crack discontinuously. Five basis points of IG widening on a stagflationary war shock is not durable resilience. It is the carry trade refusing to be interrupted. The trigger doesn’t have to be a recession. It can be a single private credit fund gating redemptions, or a high-profile software issuer defaulting, or a bank pulling a credit line. Once this breaks the repricing happens in days, not quarters. The 2026–2027 maturity wall is the obvious accelerant.
The Mag Seven concentration risk is asymmetric. 33.7% of the index, 30x forward earnings, $400B+ in fresh debt, FCF deteriorating. If just one of these names disappoints meaningfully the unwind is forced because positioning is consensus and weighting is structural. There is no marginal active buyer to absorb the supply because everyone already owns it.
“Markets can stay disconnected from fundamentals for longer than analysts can stay solvent. They eventually resolve — usually by fundamentals rising to prices, or prices falling to fundamentals. The weight of evidence currently favors the second path more than implied vol suggests.”
Section VIII
Section IX
Scenarios and Probabilities
Iran ceasefire holds, Brent drifts to $80 by Q3. Sentiment partially recovers without a full bounce. GDP stabilizes at 1.5–2.0% for 2026. Big Tech earnings hold guidance. The divergence narrows gradually as growth recovers modestly and equity multiples compress mildly. Fed holds all year. S&P finishes near 7,400–7,600, returns roughly in line with Wall Street consensus but driven less by multiple expansion than buybacks and earnings revisions. Boring is the bull case.
AI productivity gains begin showing in non-tech earnings revisions ahead of Deloitte’s 2027 timeline. Hormuz fully reopens; oil collapses to $70. Sentiment snaps back. H2 GDP prints above 2.5%. Warsh delivers two cuts. Earnings breadth expands, multiples actually expand further. The S&P moves to 8,000+. The “two economies” thesis dies as the wage economy heals.
Consumer deterioration accelerates as gas prices broaden into goods. Core PCE re-accelerates above 3%. Fed forced to acknowledge no cuts, possible hike. Big Tech guides cautiously on AI revenue conversion. Private credit stress goes public — a single fund gates, the sector reprices. IG spreads break 50bps wider; HY 200bps. Mag Seven unwinds 20%+. S&P retraces toward 6,000. Multiple compression does most of the damage.
Iran conflict re-escalates. Brent $130+. Warsh cuts under political pressure into unanchored expectations. Long end revolts; bear-steepens to 5.5% on the 10Y. Dollar weakens; foreign Treasury demand wavers. Equities collapse under combined discount-rate shock and earnings deterioration. Recession arrives in 2027. Closest historical rhyme: 1973–74 stagflation overlaid with mid-1980s policy uncertainty.
Neither is wrong. They are answering different questions, and asset prices have decided to answer the more flattering one. Economists are measuring the economy the median household lives in: a stagflationary squeeze, a frozen Fed, sentiment at multi-decade lows. They are correct. Markets are pricing the economy the asset-owning class lives in: record corporate profits, an AI capex cycle, buybacks, and mechanical passive inflows. They are also correct.
The honest read is not that the market is delusional. It is that the market is pricing a different country. The bet — which has worked for two years and is working today — is that the asset-owner economy and the wage economy can stay decoupled long enough for the consumer to recover, the AI cycle to mature, and the multiple to be ratified by earnings.
That bet requires three things: labor must hold, AI must convert capex into operating income, and the Fed must not be forced into either an inflation-fighting hike or a credibility-destroying political cut. Three coin flips. The compound probability is lower than the index suggests.
The conviction: markets are right that the AI cycle is real and that the asset-economy is genuinely insulated for now. They are dangerously casual about the timing of when the wage economy starts dragging earnings down — and about how quickly credit complacency can flip when the marginal buyer of carry gets nervous. The divergence resolves. The path of least resistance — given consumer weakness, sticky inflation, and a Fed without ammunition — is for prices to come partway to fundamentals before fundamentals come the rest of the way to prices. At a VIX in the high teens and forward multiples at 22x, the market is not paying you anywhere near enough to bear that path-dependency.